GDP per capita by country is the simplest way to compare how much economic output each person accounts for in different parts of the world. Take everything a country produces in a year, divide it by the number of people who live there, and you get a single dollar figure that can be ranked, from the richest small states to the poorest large ones.
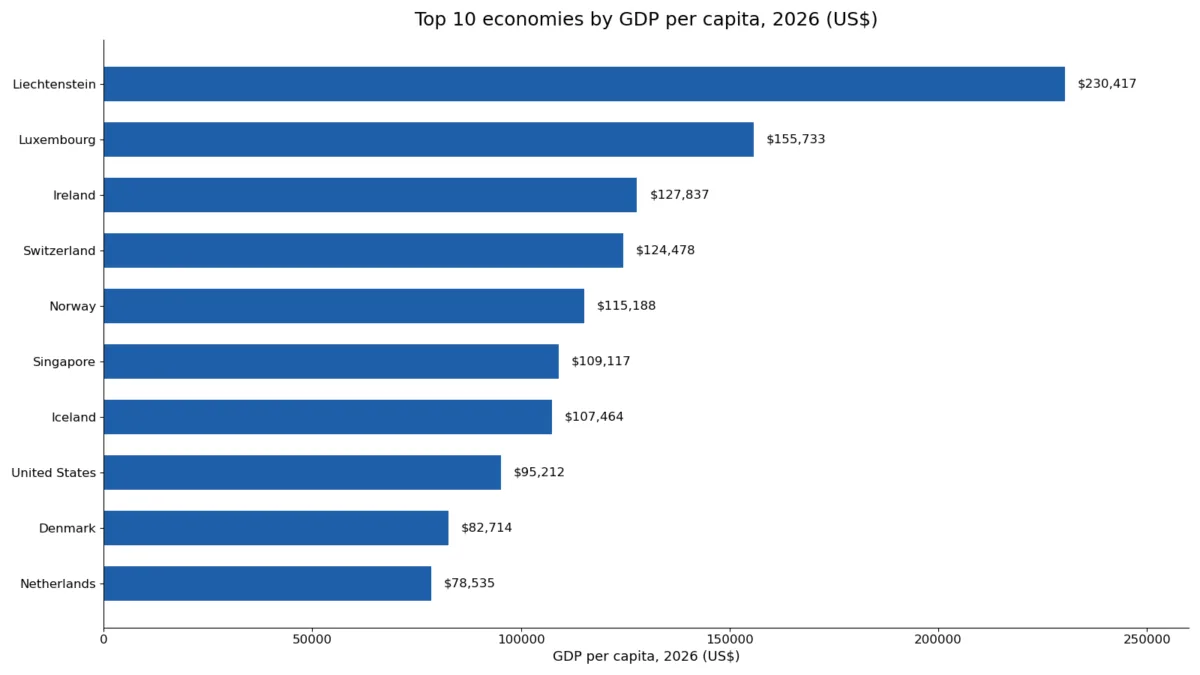
For 2026, the ranking comes from the International Monetary Fund’s World Economic Outlook database, published in October 2026. Liechtenstein leads it at $230,417 per person. Luxembourg is second at $155,733, Ireland third at $127,837, and the United States, the world’s largest economy, is eighth at $95,212.
Every 2026 figure below is an IMF projection, not a measured result. The IMF published the database on 13 October 2026, using data available up to 1 October 2026, and the numbers will be revised as national statistics offices publish their final results for the year. The 2025 figures are the latest actual national accounts data for most economies.
GDP per capita is an average, and averages hide a great deal. It is not a salary, not a measure of household wealth, and not a verdict on how well ordinary people live. But as a first cut at comparing economies, it is the figure almost every other comparison starts from.
GDP per capita by country: the top 50 in 2026
The table below ranks the top 50 economies by GDP per capita in current US dollars, at market exchange rates. The change column shows the dollar difference from 2025, and the rank column shows how many places each economy rose or fell against 2025.
| Rank | Country | GDP per capita 2026 (US$) | Change vs 2025 (US$) | Rank change vs 2025 |
|---|---|---|---|---|
| 1 | Liechtenstein | $230,417 | +$11,439 | — |
| 2 | Luxembourg | $155,733 | +$7,486 | — |
| 3 | Ireland | $127,837 | +$4,048 | — |
| 4 | Switzerland | $124,478 | +$7,287 | — |
| 5 | Norway | $115,188 | +$20,828 | +2 |
| 6 | Singapore | $109,117 | +$9,752 | -1 |
| 7 | Iceland | $107,464 | +$8,681 | -1 |
| 8 | United States | $95,212 | +$4,945 | — |
| 9 | Denmark | $82,714 | +$4,127 | — |
| 10 | Netherlands | $78,535 | +$5,271 | +1 |
| 11 | Macao SAR | $77,049 | +$2,584 | -1 |
| 12 | Australia | $75,172 | +$8,793 | +1 |
| 13 | Israel | $72,441 | +$11,542 | +6 |
| 14 | San Marino | $70,662 | +$5,041 | — |
| 15 | Sweden | $69,244 | +$5,876 | — |
| 16 | Austria | $67,020 | +$3,840 | — |
| 17 | Germany | $65,699 | +$4,444 | — |
| 18 | Belgium | $64,774 | +$3,760 | — |
| 19 | Qatar | $63,634 | −$4,260 | -7 |
| 20 | United Kingdom | $61,108 | +$3,367 | — |
| 21 | Hong Kong SAR | $60,322 | +$3,446 | — |
| 22 | Finland | $60,156 | +$3,403 | — |
| 23 | Canada | $60,105 | +$4,309 | — |
| 24 | United Arab Emirates | $57,109 | +$2,958 | — |
| 25 | Andorra | $53,988 | +$3,563 | — |
| 26 | Malta | $52,149 | +$3,644 | +2 |
| 27 | France | $51,448 | +$2,319 | -1 |
| 28 | New Zealand | $51,043 | +$2,294 | -1 |
| 29 | Italy | $45,886 | +$2,616 | — |
| 30 | Cyprus | $44,477 | +$2,561 | — |
| 31 | Taiwan | $43,951 | +$4,439 | +3 |
| 32 | The Bahamas | $43,858 | +$2,130 | -1 |
| 33 | South Korea | $43,512 | +$7,104 | +4 |
| 34 | Aruba | $42,934 | +$2,400 | -1 |
| 35 | Puerto Rico | $41,851 | +$1,231 | -3 |
| 36 | Spain | $41,756 | +$3,161 | -1 |
| 37 | Slovenia | $41,631 | +$3,911 | -1 |
| 38 | Brunei | $40,613 | +$7,979 | +5 |
| 39 | Czechia | $39,614 | +$3,326 | -1 |
| 40 | Guyana | $38,572 | +$12,468 | +13 |
| 41 | Estonia | $37,310 | +$2,674 | — |
| 42 | Saudi Arabia | $36,577 | +$1,207 | -2 |
| 43 | Lithuania | $36,135 | +$3,219 | -1 |
| 44 | Japan | $35,400 | −$719 | -5 |
| 45 | Portugal | $34,815 | +$2,751 | -1 |
| 46 | Poland | $31,186 | +$2,676 | +1 |
| 47 | Slovakia | $30,884 | +$2,386 | +1 |
| 48 | Croatia | $29,860 | +$2,754 | +2 |
| 49 | Greece | $29,413 | +$2,372 | +2 |
| 50 | Kuwait | $28,928 | −$2,645 | -5 |
Seven economies pass $100,000 per person in 2026, and six of them are in Europe. Only 23 economies in the whole ranking pass $60,000. At the other end, the IMF’s full list covers about 190 economies, and 64 of them produce less than $5,000 per person. The world median is about $9,500 a person, against a mean of roughly $23,000, which tells you how much the average is pulled up by a small number of very rich places.
Why small, rich states top the list
The top of the table is dominated by places with small populations and specialised economies, and that is not a coincidence. It is partly how the statistic is built. GDP counts output produced inside a territory, but the population figure counts only residents. Liechtenstein and Luxembourg both employ large numbers of people who commute in from neighbouring countries every day. Their work adds to GDP, but they are not in the denominator, so output per resident is pushed far above what residents themselves earn.
Ireland is a different case. Many large multinational companies hold intellectual property and book profits in Ireland, which inflates measured GDP. Ireland’s own Central Statistics Office publishes a separate measure, modified gross national income, precisely to strip out these effects, and it tells a considerably less spectacular story about Irish living standards.
Singapore and Switzerland combine high productivity with roles as financial and trading centres. Norway’s place in the top five owes a great deal to oil and gas, whose value swings with energy prices. Qatar, the United Arab Emirates, Brunei and Kuwait are in the table for the same reason: resource revenue spread across a small population. And Macao, 11th at $77,049, depends heavily on casinos and tourism, an industry that collapsed during the pandemic and has since recovered.
The United States is the exception that proves the pattern. It is the only economy with more than 100 million people anywhere near the top, and the highest-ranked large economy by a wide margin. The next most populous economies in the top 25 are Germany, the United Kingdom, Canada and Australia.
The big movers in 2026
Norway makes the largest dollar gain in the top 50, rising $20,828 per person to $115,188, which lifts it from seventh to fifth. Israel climbs six places to 13th, up $11,542 to $72,441, and Australia rises on a $8,793 gain to $75,172. Guyana is the biggest climber of all, up 13 places to 40th at $38,572, a $12,468 jump driven by its expanding oil sector.
Only three economies in the top 50 are projected to fall in dollar terms. Qatar drops $4,260 to $63,634 and slides seven places to 19th, the biggest fall in the ranking. Kuwait falls $2,645 to $28,928 and drops five places to 50th. Japan falls $719 to $35,400, also down five places to 44th, and is overtaken by South Korea, which rises four places to 33rd at $43,512. Japan is the only G20 member whose dollar figure falls in 2026, and the weakness mainly reflects the yen’s exchange rate rather than a fall in output: at purchasing power parity, Japan reaches $59,712.
Most of these year-to-year moves say more about exchange rates and commodity prices than about how much each worker produces. A currency that strengthens against the dollar lifts a country’s whole ranking without anyone working an extra hour, and a weaker currency does the reverse. That is why rankings built on dollar values can shift sharply even when the underlying economies grow steadily.
Where India ranks, and why it looks so different from total GDP
India does not appear in the top 50 at all. The IMF projects India’s GDP per capita at $2,750 for the fiscal year 2026/27, up from $2,670 the year before. That puts India in the bottom quarter of the IMF’s ranking, below Kenya at $2,785 and above Laos at $2,331. India is the world’s most populous country, so its total economy is among the largest on earth, but divided among more than 1.4 billion people, output per person is small.
The contrast with China is instructive. China is the world’s second-largest economy in total, yet its GDP per capita is $15,371, ranking 77th, just below Malaysia and Argentina. The United States produces 6.2 times as much per person as China at market exchange rates. India, meanwhile, is not in the same league as either: its per-person output is about 18 percent of China’s.
The picture changes when prices are taken into account. Adjusted for purchasing power parity, which values goods and services at the same prices everywhere, India’s $2,750 becomes about $13,000 international dollars, because everyday prices in India are far lower than in the United States. The ratio of 4.73 between the two figures is the highest in the G20. Even on that basis, though, the United States produces about 7.3 times as much per person as India, against 34.6 times at market exchange rates.
India’s figures are reported on a fiscal year basis, April to March, which is how the IMF presents Indian data. The country’s low per-person figure is not a judgement on its growth: India is the fastest growing large economy in the IMF’s 2026 projections. It is a reminder that total size and prosperity per person are different things, and a country can be both a giant economy and a low-income one per head.
What GDP per capita does, and does not, say about living standards
Read the ranking as a measure of production, not of wellbeing. It says nothing about how output is shared. A country can have high output per person and a large share of low-income households, and the gap between average and typical incomes is wide almost everywhere. It also says nothing about what money buys locally, which is why the purchasing power version of the ranking looks so different.
At purchasing power parity, Liechtenstein still leads, at $198,990 international dollars, but Singapore jumps from sixth to second at $176,930, and Taiwan rises from 31st in nominal terms to ninth. Switzerland drops from fourth to seventh because its prices are among the highest in the world, and Iceland falls from seventh to 18th for the same reason. The United States, by construction, has the same figure on both measures: $95,212.
The ranking also leaves out things that matter to daily life and are not counted in GDP at all: unpaid care work, the quality of public services, health and education, and the state of the environment. None of that makes the table useless. It makes it a starting point. A high figure means an economy produces a great deal per resident. Whether that production reaches residents as income, services and security is a question the table cannot answer, and it is the question that matters most.
Frequently asked questions
Which country has the highest GDP per capita in 2026?
Liechtenstein, at $230,417 per person, according to the IMF World Economic Outlook database of October 2026. Monaco is not in the IMF series: the World Bank reports about $288,002 per person for Monaco in 2024, but that is a different year and a different source, so it cannot be placed at the top of a 2026 IMF table.
What is GDP per capita?
It is a country’s total economic output in a year, GDP, divided by its population. It is an average, not a typical income: it says how much is produced per resident, not how much the average resident earns or owns.
Why is the United States only eighth?
Because the ranking divides output by population, and the United States has about 340 million people. Its total GDP is the largest in the world, at about $32.64 trillion, but smaller, highly specialised economies produce more per resident. The United States is still the highest-ranked large economy by a wide margin.
Related rankings
- Countries by GDP 2026
- Countries by GDP (PPP) 2026
- Fastest Growing Economies 2026
- IPL Points Table 2026
- Top Programming Languages 2026
- Countries by Population 2026
- Indian States by GDP 2025
More from Newsy: Fastest Growing Economies 2026: Top 20 Ranked by IMF Projections and India Faces a More Painful Return to Higher Interest Rates as Inflation Breaches 6%.
Last updated: 18 November 2026
Source: IMF World Economic Outlook database, October 2026 (indicator NGDPDPC, GDP per capita, current US dollars), also published on the IMF DataMapper. The 2026 figures are IMF projections. Ranks cover the economies with a 2026 figure in the IMF database; 2025 values are the latest actual data for most economies. Figures were cross-checked against the IMF DataMapper API values reproduced by Visual Capitalist and Global Macro Expert.